FroalaCharts will render here
{
  "chart": {
    "caption": "AdWords Campaign Analysis",
    "subcaption": "Conversions as % of total",
    "xaxisname": "# Conversions",
    "yaxisname": "Cost Per Conversion",
    "numberprefix": "$",
    "theme": "froala",
    "plottooltext": "$name : Share of total conversion: $zvalue%"
  },
  "categories": [
    {
      "verticallinealpha": "20",
      "category": [
        {
          "label": "0",
          "x": "0"
        },
        {
          "label": "1500",
          "x": "1500",
          "showverticalline": "1"
        },
        {
          "label": "3000",
          "x": "3000",
          "showverticalline": "1"
        },
        {
          "label": "4500",
          "x": "4500",
          "showverticalline": "1"
        },
        {
          "label": "6000",
          "x": "6000",
          "showverticalline": "1"
        }
      ]
    }
  ],
  "dataset": [
    {
      "data": [
        {
          "x": "5540",
          "y": "16.09",
          "z": "30.63",
          "name": "Campaign 1"
        },
        {
          "x": "4406",
          "y": "12.74",
          "z": "24.36",
          "name": "Campaign 2"
        },
        {
          "x": "1079",
          "y": "15.79",
          "z": "5.97",
          "name": "Campaign 3"
        },
        {
          "x": "1700",
          "y": "8.27",
          "z": "9.4",
          "name": "Campaign 4"
        },
        {
          "x": "853",
          "y": "15.89",
          "z": "4.71",
          "name": "Campaign 5"
        },
        {
          "x": "1202",
          "y": "10.74",
          "z": "6.65",
          "name": "Campaign 6"
        },
        {
          "x": "2018",
          "y": "6.14",
          "z": "11.16",
          "name": "Campaign 7"
        },
        {
          "x": "413",
          "y": "19.83",
          "z": "2.28",
          "name": "Campaign 8"
        },
        {
          "x": "586",
          "y": "13.96",
          "z": "3.24",
          "name": "Campaign 9"
        },
        {
          "x": "184",
          "y": "15.82",
          "z": "1.02",
          "name": "Campaign 10"
        },
        {
          "x": "311",
          "y": "5.83",
          "z": "1.72",
          "name": "Campaign 11"
        },
        {
          "x": "35",
          "y": "10.76",
          "z": "0.19",
          "name": "Campaign 12"
        },
        {
          "x": "55",
          "y": "2.73",
          "z": "0.3",
          "name": "Campaign 13"
        },
        {
          "x": "6",
          "y": "21.22",
          "z": "0.03",
          "name": "Campaign 14"
        }
      ]
    }
  ]
}<html>
<head>
<title>My first chart using FroalaCharts</title>
<script src=https://unpkg.com/froalacharts@1.0.0/froalacharts.js></script>
<script src="https://unpkg.com/froalacharts@1.0.0/themes/froalacharts.theme.froala.js"></script>
<script type="text/javascript">
var data = {
chart: {
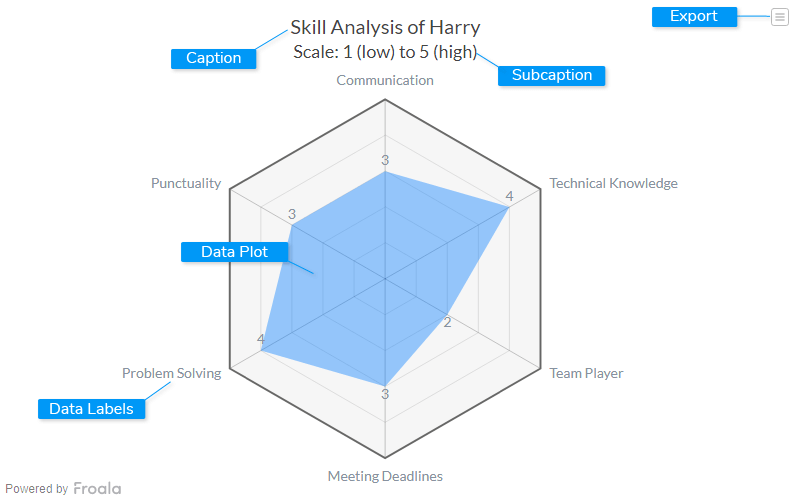
caption: "Skill Analysis of Harry",
subcaption: "Scale: 1 (low) to 5 (high)",
theme: "froala",
showlegend: "0",
showdivlinevalues: "0",
showlimits: "0",
showvalues: "1",
plotfillalpha: "40",
plottooltext: "Harry's $label skill is rated as $value"
},
categories: [
{
category: [
{
label: "Communication"
},
{
label: "Punctuality"
},
{
label: "Problem Solving"
},
{
label: "Meeting Deadlines"
},
{
label: "Team Player"
},
{
label: "Technical Knowledge"
}
]
}
],
dataset: [
{
seriesname: "User Ratings",
data: [
{
value: "3"
},
{
value: "3"
},
{
value: "4"
},
{
value: "3"
},
{
value: "2"
},
{
value: "4"
}
]
}
]
};
FroalaCharts.ready(function () {
froalacharts = new FroalaCharts({
id: "chart_1",
type: 'radar',
renderAt: 'ft',
width: '800',
height: '500',
dataSource: data
});
froalacharts.render();
});
</script>
</head>
<div id="msg" class="mb-20"> Chart data in the selected format will be displayed here.</div>
<body>
<div id="ft">FroalaCharts will render here</div>
</body>
</html>