


Create a Chart using Next.js and Froala Charts

Next.js is an open-source React development framework for developing single-page JavaScript applications. Next.js popularity has risen over the past couple of years given its ability to speed up page load times with Server Speed Rendering and automatic code-splitting, along with improved development time. The StateofJS 2020 Survey ranked Next.js as the top backend framework with the highest satisfaction ranking.
Froala Charts provides interactive charts to build data visualizations for web and mobile applications. From the creators of the Best WYSIWYG HTML Editor, Froala Charts offers all varieties of charting components—basic charts, widgets, and domain-specific charts that work across frameworks.
If you are wondering how to render a chart with Next.js, this article is for you! This tutorial will walk you through creating a dynamic chart in React using Next.js and Froala Charts.
Setting up the Environment
We’ll be using codesandbox for this tutorial. Before we start, we need to set up our environment by including the following dependencies in our application’s package.json:
This is what our package.json should look like after adding the above dependencies:
"dependencies": {
    "froalacharts": "^1.0.0",
    "next": "latest",
    "react": "^16.13.1",
    "react-dom": "^16.13.1",
    "react-froalacharts": "^1.0.0"
}
Creating the Chart Component
Now that we are done with setting up our environment, we’ll create a component that we’ll import later to render the chart. For this tutorial, we are going to use static data, but you can also pass dynamic data using props or fetching data via API to render charts.
For this we’ll create a JS file under pages directory with the name froalacharts.js:
Step 1: Prepare Chart Data Source
const dataSource = {
chart: {
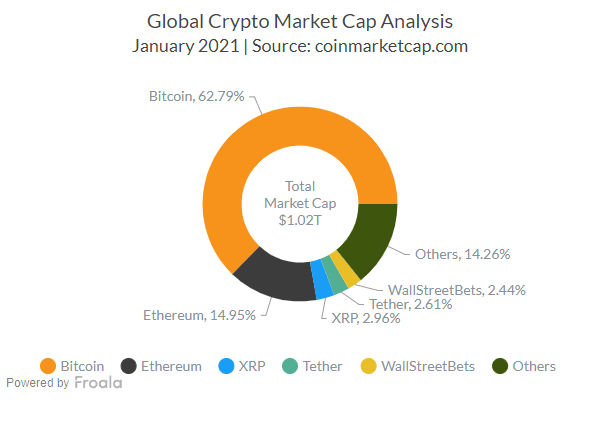
caption: "Global Crypto Market Cap Analysis",
subCaption: "January 2021 | Source: coinmarketcap.com",
theme: "froala",
paletteColors: "#F7931A, #3c3c3d, #1A9DF6, #52AF94, #E7BF29, #3D550C",
numberPrefix: "$",
defaultCenterLabel: "Total Market Cap<br>$1.02T",
centerlabel: "$label<br>$value",
doughnutRadius: "60%"
},
data: [
{ label: "Bitcoin", value: "640481178825" },
{ label: "Ethereum", value: "152441577181" },
{ label: "XRP", value: "30193577746" },
{ label: "Tether", value: "26618100965" },
{ label: "WallStreetBets", value: "24846486000" },
{ label: "Others", value: "145419079283" }
]
};
Step 2: Create Chart Instance
const chartConfigs = {
  type: "doughnut",
  width: 600,
  height: 400,
  dataFormat: "json",
  dataSource: dataSource
};
There are multiple chart options in Froala Charts—basic charts such as column, line, pie charts, gauges, KPI, funnel, pyramid, or advanced charts, e.g. heat maps, treemaps, radar, statistical charts, and more for domain-specific usage. Check out the complete list of charts, learn how to customize the charts, or explore the chart attributes.
Step 3: Export Chart Component
export default function NextFC() {
  const FroalaCharts = require("froalacharts");
  const FroalaTheme = require("froalacharts/themes/froalacharts.theme.froala.js");
  const { default: ReactFC } = require("react-froalacharts");

  ReactFC.fcRoot(FroalaCharts, FroalaTheme);

  return <ReactFC {...chartConfigs} />;
}
Render the Chart
Now that we have created the chart component i.e., froalacharts.js; we’ll now import this component into our index.js (the parent component) to render the chart.
import dynamic from "next/dynamic.js";
const FC = dynamic(() => import("./froalacharts.js"), { ssr: false });
export default function IndexPage() {
  return (
    <div>
      <FC></FC>
    </div>
  );
}
If you have followed the above steps correctly, your output should look as shown in the image below:
If you are having trouble rendering the chart, you can check the source code for this sample from this codesandbox.
Froala Charts Free Trial
Take a tour of Froala Charts and try out the charting library for free. Interested in the Froala Charts license plans? Check them out here.
Got questions? Leave a comment or feel free to drop an email to support@awsstage.froala.com.


No comment yet, add your voice below!