A funnel chart is used to show streamlined data or the data at various stages in a process. The chart shows the progressive reduction of data as it passes from one phase to another, thus helping to identify the problem areas within a process. It is visualized like a funnel that is divided into multiple segments, each segment representing a stage in the process. A segment's height is determined by the data value that it represents. The width is determined by the segment's order in the stack of segments that create the funnel and has nothing to do with the data value. Segments can be sliced out in order to focus on a particular phase.
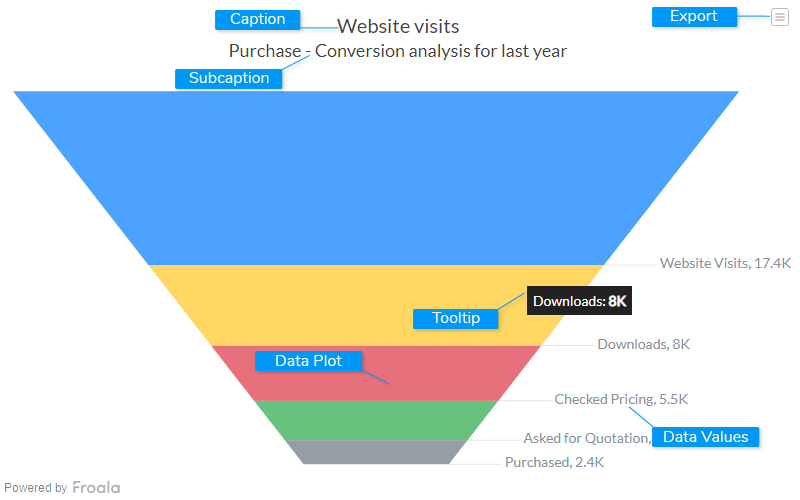
Caption
The caption (also called the chart title) is the heading of your chart. You can add custom text for the caption, as well as configure its font properties and cosmetics. Learn more about it
Subcaption
The sub-caption (also called the chart subtitle) is the sub-heading of your chart. You can add custom text for sub-caption, as well as configure its font properties.
Data Plot
Data plot refers to the columns of the funnel chart.
Data Values
Data values refers to values associated with each section.
Tooltip
A tooltip is displayed when the mouse cursor hovers over a particular data point. It denotes valuable information about the data plot hovered.
Export Menu
Export menu that appears on top-right of the chart, it offers different options to export a chart.
You can enable or disable chart export using attributeexportEnabled. Refer to Exporting Charts to learn
more.